How-to guide · Work & Study
7 Venn Diagram Mistakes That Make Compare-and-Contrast Work Weaker
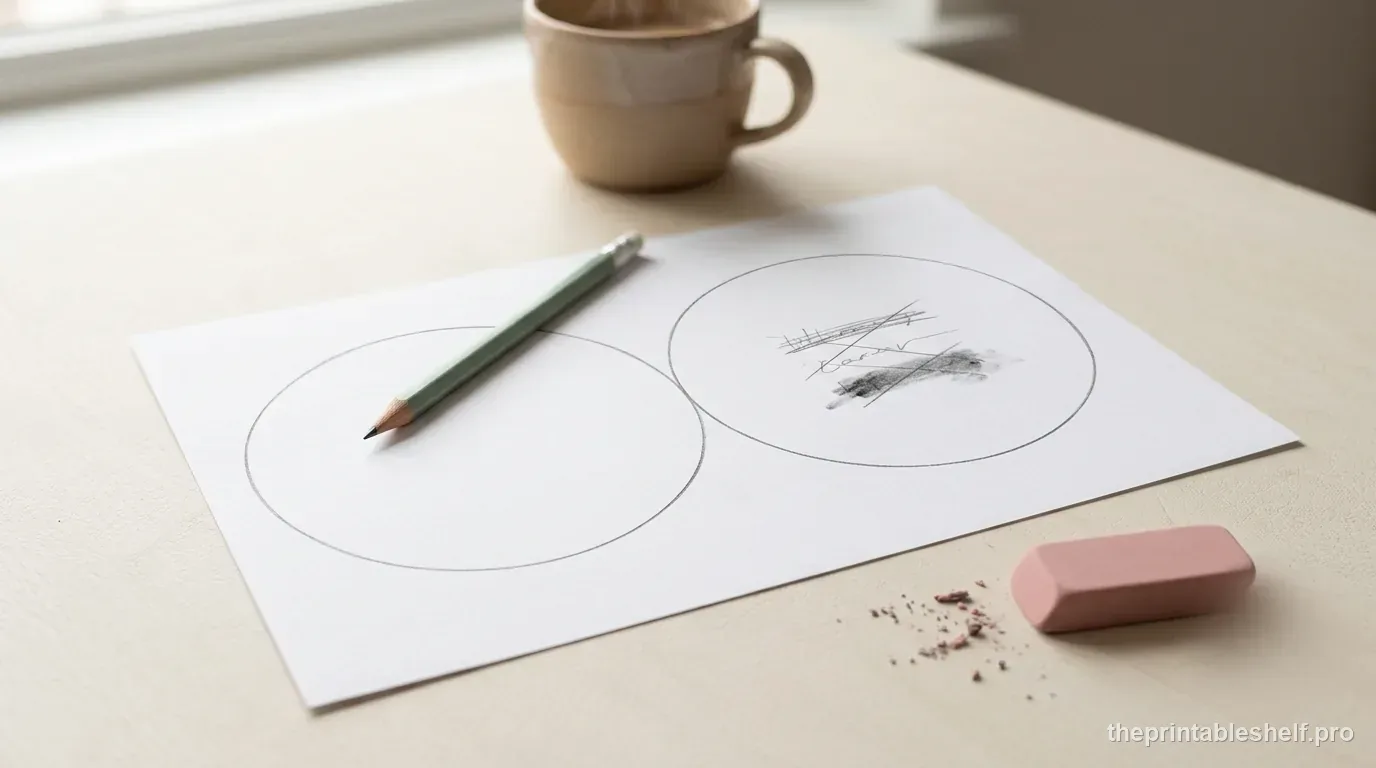
A Venn diagram can look complete while containing very little comparison. Students can fill both circles with facts, add two generic similarities in the middle, and still avoid the real work: comparing the same dimensions across two subjects and deciding which similarities or differences matter. The diagram is useful only when the placement reflects a defensible relationship.
ReadWriteThink's Venn Diagram Rubric treats the organizer as a skill that should be modeled, discussed, evaluated, and eventually connected to a final writing product. That is a useful standard for troubleshooting. The goal is not to make the circles full. The goal is to make each region mean something, then use the pattern to support a conclusion.
Mistake 1: comparing different criteria on each side
A weak comparison often begins with unmatched facts. One side says where Subject A lives while the other says what Subject B eats. Both statements may be correct, but they are not a comparison pair. Before writing details, choose criteria that can be applied to both subjects: habitat, structure, purpose, response, evidence, cost, theme, character goal, or whatever fits the task.
A fast repair is to write a small set of meaningful criterion labels above the diagram before filling it. Then test each detail: Could I ask the same question about both subjects? If not, either find the matching information or move that fact to notes outside the Venn diagram.
Mistake 2: putting a statement in the overlap just because the words sound similar
The overlap means the statement is true of both subjects at the level that matters for the assignment. It does not mean both entries use the same vocabulary. If two characters are described as brave, for example, ask whether the text shows bravery in comparable ways. One may confront danger for another person while the other takes a social risk. The shared trait may still belong in the middle, but the evidence should show why.
Use a two-part overlap test: Is the claim accurate for A? Is the same claim accurate for B? If either answer is no or only partly, rewrite the similarity more precisely. Vague overlap such as both are interesting, both have differences, or both are important rarely helps with later writing.
Mistake 3: treating 'not mentioned' as a difference
Suppose Text A says a habitat receives heavy rainfall and Text B says nothing about rainfall. Writing heavy rainfall only in A's outer circle may be appropriate as an A-only detail, but writing B has little rainfall would be an unsupported inference. A Venn diagram should distinguish evidence from assumption.
When information is missing, mark it as not stated in your working notes rather than converting silence into the opposite fact. This is especially important when comparing two informational texts that do not cover identical subtopics. The diagram should represent what the sources support, not force symmetry where none exists.
Mistake 4: filling the circles with sentences that are too long to compare
A Venn diagram is a visual sorting tool, not the final essay. Long sentences crowd the overlap, make repeated criteria hard to scan, and encourage copying from the text. Use compact phrases that preserve the important idea: migrates seasonally, uses solar energy, narrator knows one character's thoughts, or conflict resolved through compromise.
If a detail needs a full explanation or quotation, put a short label in the diagram and keep the evidence in notes beside it. When the task requires longer reasoning, the site's box-based compare-and-contrast organizer is usually a better choice because it gives each claim more writing room.
Mistake 5: collecting facts without deciding which differences matter
Not every true difference deserves equal weight. Two novels may have different cover colors, publication dates, settings, narrators, conflicts, and endings. If the question asks how point of view shapes the reader's understanding, cover color is irrelevant even though it is different. Comparison is selective reasoning.
Before adding a detail, finish the sentence: This matters because ___. If you cannot connect the detail to the assignment, theme, question, or decision, leave it out. This keeps the organizer from becoming a trivia inventory and makes the later paragraph much easier to write.
Mistake 6: skipping evidence when the task is text-based
A diagram can contain reasonable claims that are still too broad for academic use. If the assignment is based on two texts, attach a page number, scene, quotation fragment, data point, or brief evidence note to the strongest entries. You do not need evidence for every obvious label, but the claims you expect to use in writing should be traceable to the source.
ReadWriteThink's compare-and-contrast materials treat organizers as preparation for discussion or writing, not as an endpoint. Evidence is what lets a student move from two-circle sorting to a defensible sentence such as both authors present adaptation as necessary, but only Text B shows the cost of that adaptation through the narrator's choices.
Mistake 7: stopping when the Venn diagram is full
A finished diagram should lead to a decision, explanation, or piece of writing. ReadWriteThink's Venn rubric explicitly notes that once students can use the organizer, assessment should become more specific to the content and final writing product. The useful question after sorting is: What pattern do these similarities and differences reveal?
Circle the one shared feature and one contrast that best answer the task. Then write a comparison sentence that names both: Although A and B both ____, A ____ while B ____. For more advanced work, add why that contrast matters. The diagram supplies the raw material; the conclusion supplies the thinking.
Worked repair: from a weak diagram to a useful one
Imagine a student comparing two fictional schools. The left circle says has a library, 600 students, built in 1980. The right says blue uniforms, long lunch break, has a music room. The overlap says both are schools. The problem is not that the facts are false. The criteria are inconsistent and the only similarity is too obvious to support a meaningful conclusion.
Repair the diagram around matched criteria: learning spaces, schedule, student support, and extracurricular opportunities. Now both schools can be compared under each dimension. The overlap might show that both provide dedicated arts spaces. One outer region might show School A has a longer independent-study block while the other shows School B has a longer lunch period. The final conclusion can then explain how the schools organize time and resources differently rather than merely restating six unrelated facts.
Use a T-chart or comparison table when the circles fight the content
Venn diagrams are strongest when overlap is central and entries can stay short. They become awkward when you have many criteria, long evidence, numeric comparisons, or a need to compare two subjects row by row. In those cases, a T-chart or comparison table can be more readable. The Venn diagram should earn its circles by making shared traits visually meaningful.
This is why the choice of organizer matters as much as the filling process. If students keep shrinking handwriting, drawing arrows outside the circles, or repeating category labels, the problem may be the format rather than the thinking. Switch tools instead of treating cramped layout as a student error.
A five-point Venn diagram quality check
Before using the diagram for discussion or writing, check five things. First, the same criteria can be applied to both subjects. Second, every overlap entry is genuinely true of both. Third, outer-region entries are supported differences rather than guesses from missing information. Fourth, the strongest claims have evidence or a source note. Fifth, you can state a meaningful conclusion from the pattern.
If all five are true, the Venn diagram is doing its job. If the page is full but one of those checks fails, revise the comparison before adding more details. More entries do not automatically create a stronger analysis.
Frequently asked questions
What should go in the middle of a Venn diagram?
Put features that are genuinely true of both subjects in the overlap. Use precise shared characteristics rather than vague statements, and verify the claim against both subjects before placing it in the middle.
How many similarities and differences should a Venn diagram have?
There is no universal required number. Use enough entries to answer the task with meaningful matched criteria. Three strong comparisons tied to evidence can be more useful than ten unrelated facts.
When is a Venn diagram the wrong graphic organizer?
Use another format when the comparison requires long explanations, many criteria, numeric values, or row-by-row evidence. A T-chart or comparison table is often clearer when overlap is not the main relationship.
Printables for this topic
Free Printable Venn Diagram Template →
This free Venn diagram template gives you two large overlapping circles for comparing two topics. Put traits unique to each topic in the outer sections and shared traits in the overlap. It works for reading, science, social studies, decision-making, and study review, with Letter, A4, and PNG downloads.
Free Compare and Contrast Graphic Organizer →
This free compare and contrast organizer separates details that belong only to Topic A, only to Topic B, and to both. A conclusion box then asks the learner to state the most important comparison. It works for texts, concepts, people, events, or choices and downloads in Letter, A4, or PNG.
Free Printable 3-Circle Venn Diagram →
A 3-circle Venn diagram compares three topics at once, showing traits unique to each topic, traits shared by each pair, and traits shared by all three in the center. This printable is best for short phrases and category-level comparisons where the overlaps themselves matter, such as comparing three texts, organisms, systems, or options.
References
These sources support the instructional background in this guide. The printable recommendations and usage notes above are The Printable Shelf's editorial guidance.
- ReadWriteThink — Venn Diagram Rubric — Current rubric guidance on modeling strong Venn-diagram use, peer feedback, and moving assessment from organizer use to content and final writing.
- ReadWriteThink — Comparing and Contrasting: Picturing an Organizational Pattern — Classroom lesson connecting Venn diagrams and compare-contrast charts to the drafting stage of comparison writing.
- ReadWriteThink — Compare and Contrast Rubric — Assessment guidance for moving from organizer work to a coherent compare-and-contrast writing product.
- ReadWriteThink — Venn Diagram, 2 Circles — Classroom guidance on teaching the overlap/outer-region logic of Venn diagrams and practicing first with familiar comparisons.
- IES What Works Clearinghouse — Read STOP Write study — Includes explicit compare/contrast text-structure work with graphic organizers, supporting the article's emphasis on matching organizer structure to the reasoning task.
Keep reading
Venn Diagram vs. T-Chart: Which One Should You Use?
Compare Venn diagrams and T-charts, see when each organizer works best, and use a simple decision rule for reading, writing, and classroom tasks.
Read guide →
How to Compare and Contrast Two Texts Without Just Making a List
Learn how to compare and contrast two texts by matching criteria, gathering evidence, using a Venn diagram, and turning notes into a clear response.
Read guide →
How to Use Graphic Organizers Effectively (Without Turning Them Into Busywork)
Learn how to choose, model, scaffold, and reuse graphic organizers so students think with them instead of simply filling in boxes.
Read guide →