Work & Study · Free printable
Free Printable Venn Diagram Template
This free Venn diagram template gives you two large overlapping circles for comparing two topics. Put traits unique to each topic in the outer sections and shared traits in the overlap. It works for reading, science, social studies, decision-making, and study review, with Letter, A4, and PNG downloads.
Edited by Tessa Vaughn · Planning & Organization Editor
Free download
Choose your file size
Print at 100% / Actual Size for the cleanest margins. Pick the paper size your printer normally uses.
Share to Google Classroom ↗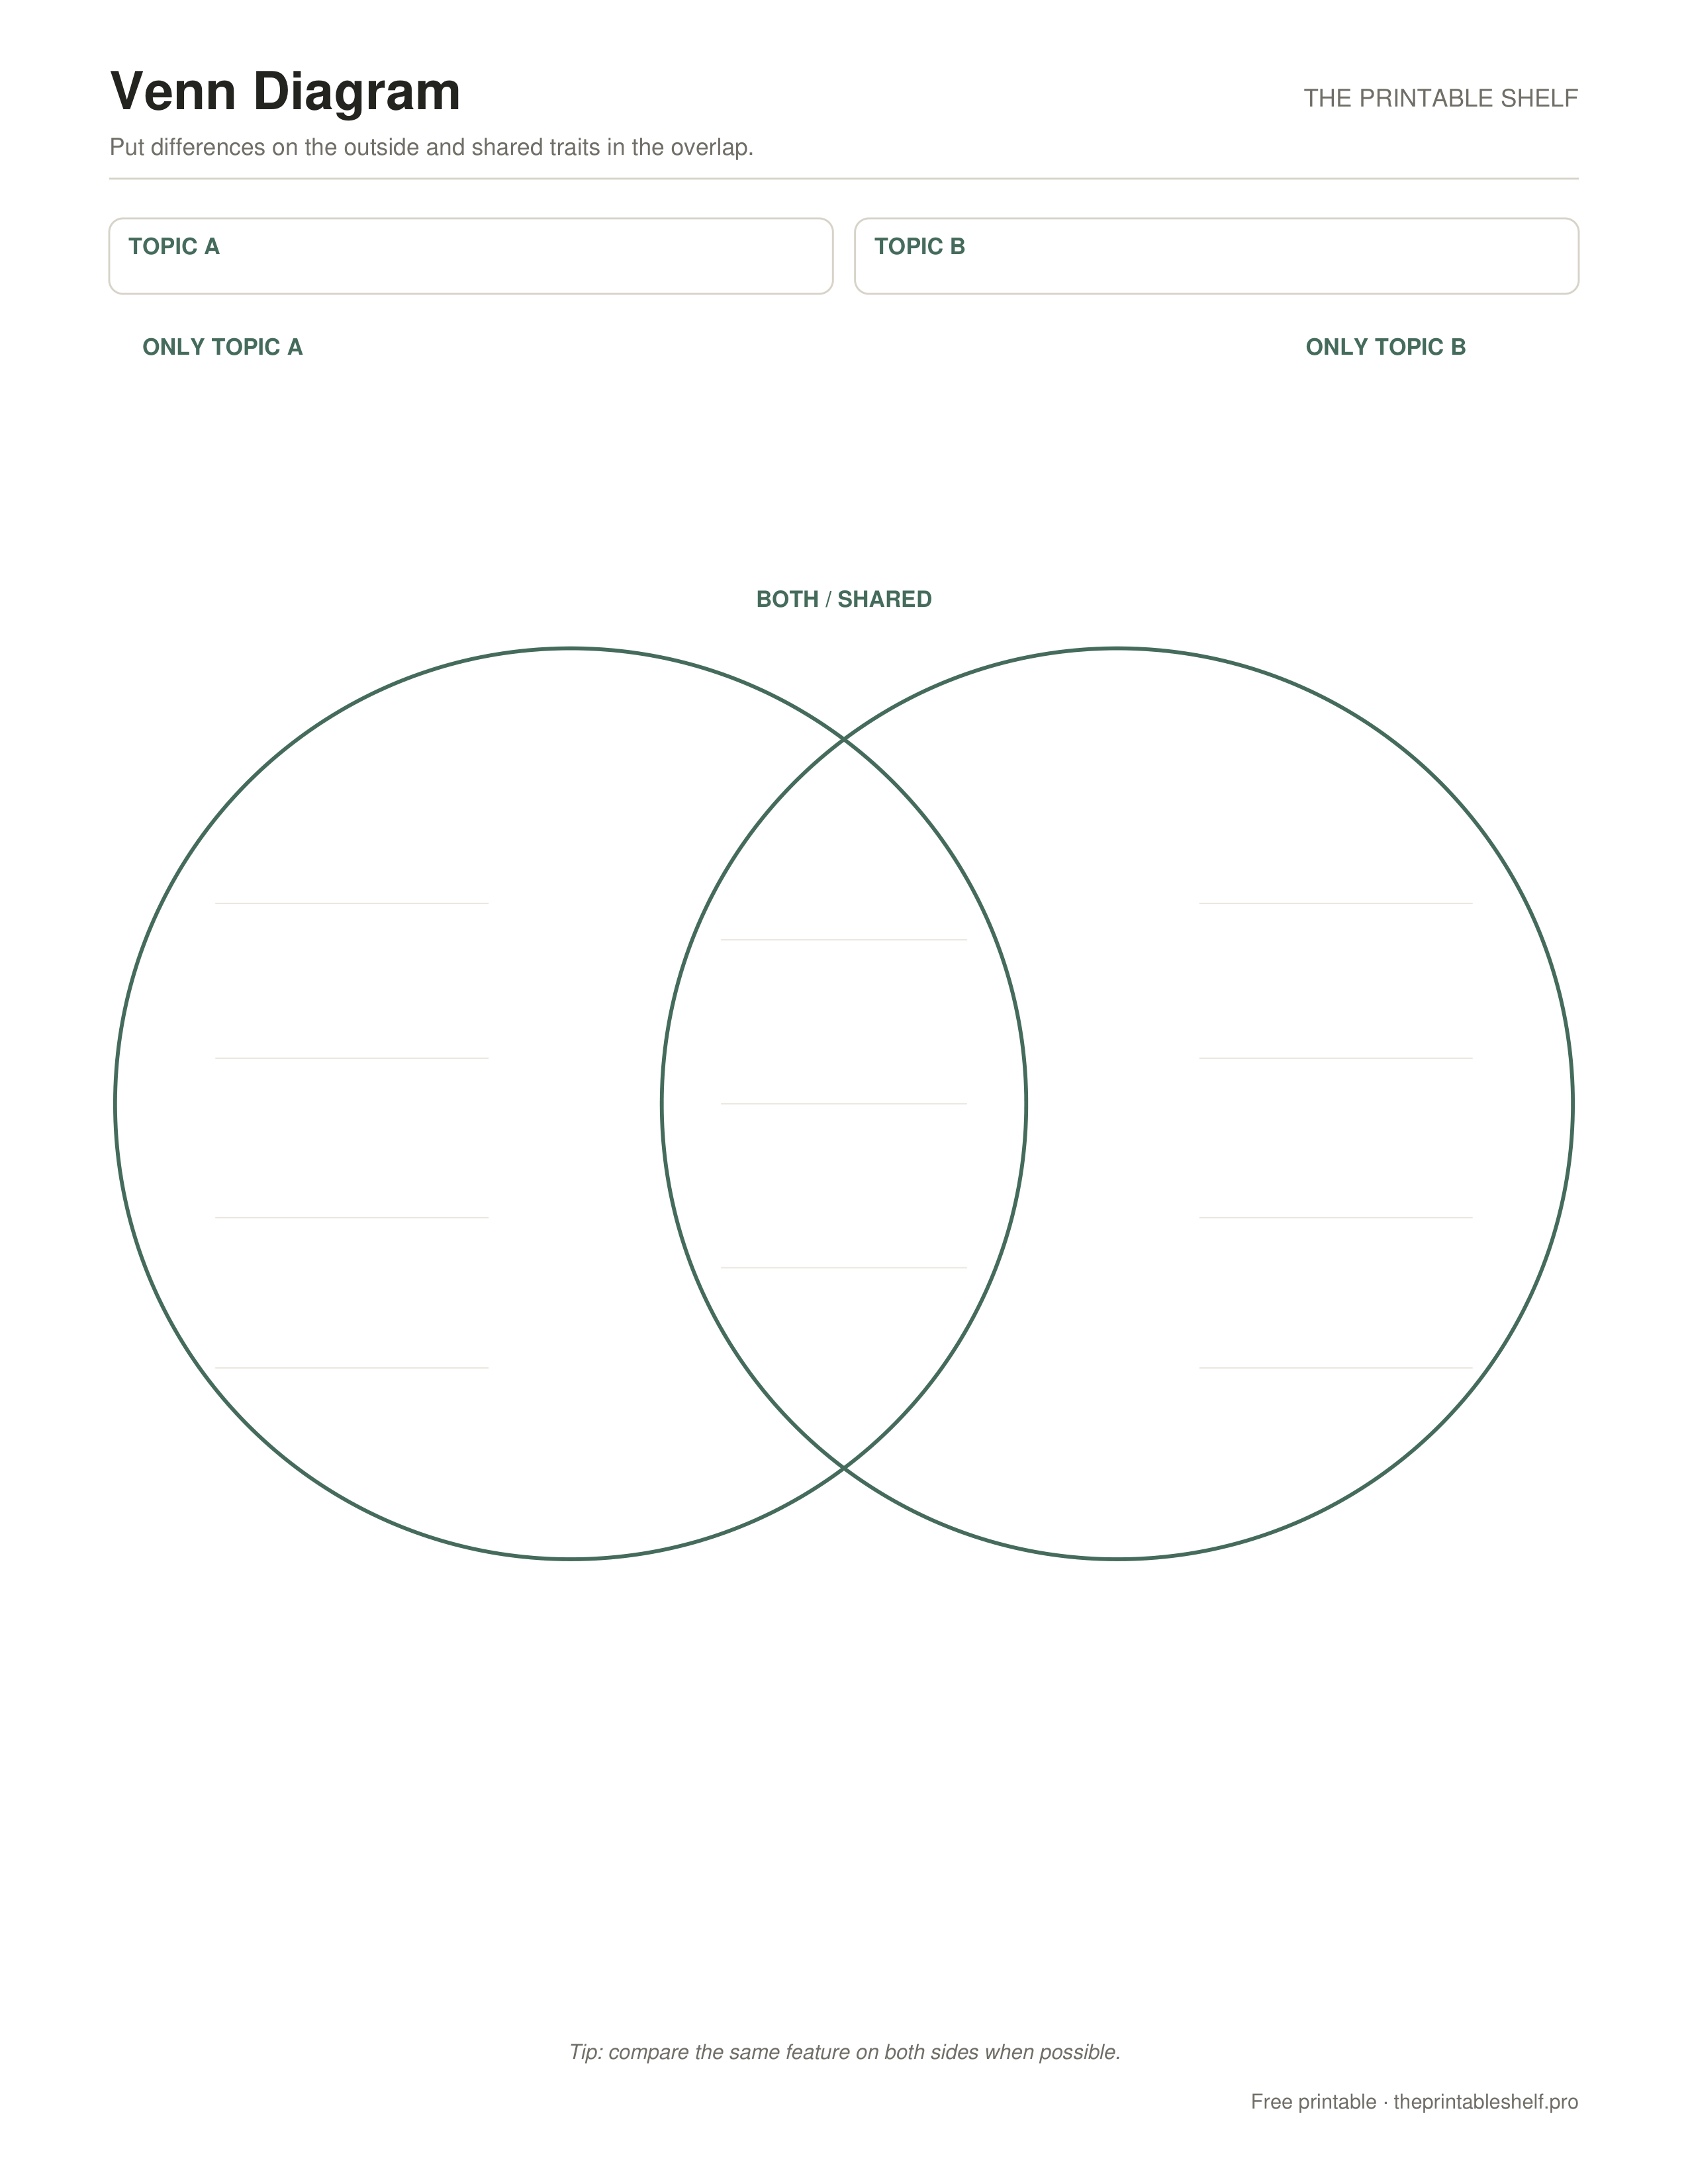
No sign-up required · personal/classroom use
What this page helps with
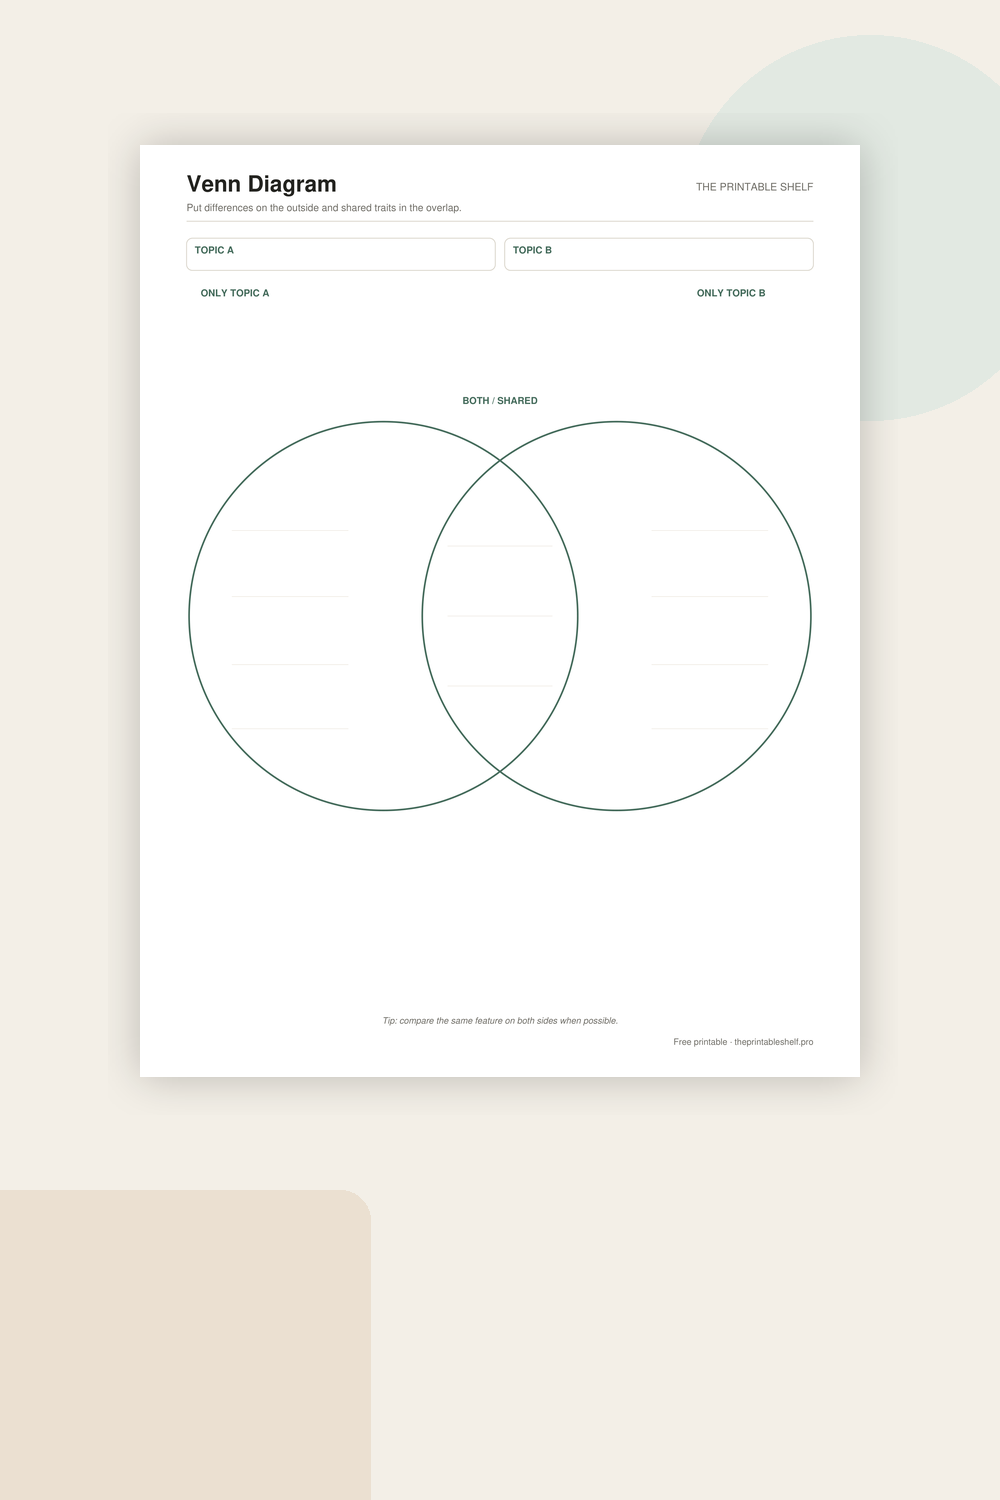
A clean two-circle comparison organizer with dedicated topic fields, generous writing space, and light writing guides. The page is intentionally simple so the visual relationship does the teaching: differences stay on the outside, while anything true of both topics belongs in the middle overlap.
A simple way to use it
Write the two things you are comparing in the Topic A and Topic B fields before adding any details. The comparison works best when both topics are at roughly the same level, such as two characters, two habitats, two historical events, or two possible solutions. If one topic is very broad and the other is narrow, tighten the broader topic first so the circles do not turn into two unrelated lists.
Add information that belongs only to Topic A in the left outer section and information unique to Topic B in the right outer section. Compare the same feature on both sides whenever you can. For example, if you record a character's motivation on the left, look for the other character's motivation on the right. Parallel details make the finished diagram easier to interpret than a collection of random facts.
Use the overlapping center for traits, evidence, or characteristics that genuinely apply to both topics. Avoid vague similarities such as “both are interesting.” A stronger entry names the shared feature: both use renewable energy, both characters hide important information, or both events caused a change in policy. If two things seem similar but differ in an important way, put the shared part in the center and explain the distinction in the outer sections.
After filling the diagram, look for a pattern instead of stopping at the notes. Ask which similarity matters most, which difference changes your understanding, or whether one topic has a feature the other consistently lacks. For a paragraph or essay, use that pattern to draft a comparison sentence. The diagram becomes much more useful when it leads to an actual conclusion rather than serving only as a sorting exercise.
For younger learners, complete the first comparison together and model where one example belongs before they work independently. For older students, require evidence beside important claims or have them color-code categories such as causes, effects, features, or themes. If you need more room for full sentences, use the compare-and-contrast organizer instead; this Venn version is best when short phrases and visual relationships are the priority.
Customize instead
Need a different title, paper size, or orientation? →
Use the free Graphic Organizer Maker to build a custom Venn, KWL, Frayer, story map, T-chart, main-idea, sequence, or cause-and-effect page.
Also in a free pack
Download this organizer together with related pages when you want one reusable master PDF instead of separate files.
Good matches for this page
Three ways to use it
Sort shared versus unique traits
Put only characteristics true of both subjects in the overlap and keep features unique to one subject in that subject's outer region.
Brainstorm before writing
Use short phrases to collect comparison material, then select the strongest pattern and move it into a more detailed outline or paragraph.
Check a comparison claim
If a supposed similarity cannot honestly sit in the overlap, revise the claim or the criterion before using it as evidence.
Common mistakes to avoid
Putting similarities outside the overlap
Reserve the center for traits that truly apply to both subjects; the outer regions are for differences.
Writing full paragraphs inside the circles
Use concise phrases. Move longer evidence and explanation into a compare-and-contrast chart or draft.
Comparing unrelated features
Choose a shared comparison criterion so the two sides answer the same question.
Classroom fit
Suggested grades, use modes & standards
Suggested grade bands
These are practical use ranges, not hard limits. Text complexity and the amount of teacher modeling matter more than the worksheet alone.
Good fit for
Scaffold level: Beginner.
Common Core crosswalk
No narrow standards code is listed for this general-purpose template. Use it where the thinking task fits your local curriculum.
Common questions
What goes in the middle of a Venn diagram?
Put traits, facts, or characteristics that are true of both topics in the overlapping middle section.
Can I use this Venn diagram for subjects other than reading?
Yes. It works for science concepts, historical events, products, choices, processes, or any two topics with meaningful similarities and differences.
Is this template better for notes or full sentences?
It is designed mainly for short notes and phrases. Use a box-based compare-and-contrast organizer when you need longer written explanations.
Helpful guides
See where this organizer fits, when a different layout works better, and how to turn the completed page into a useful next step.
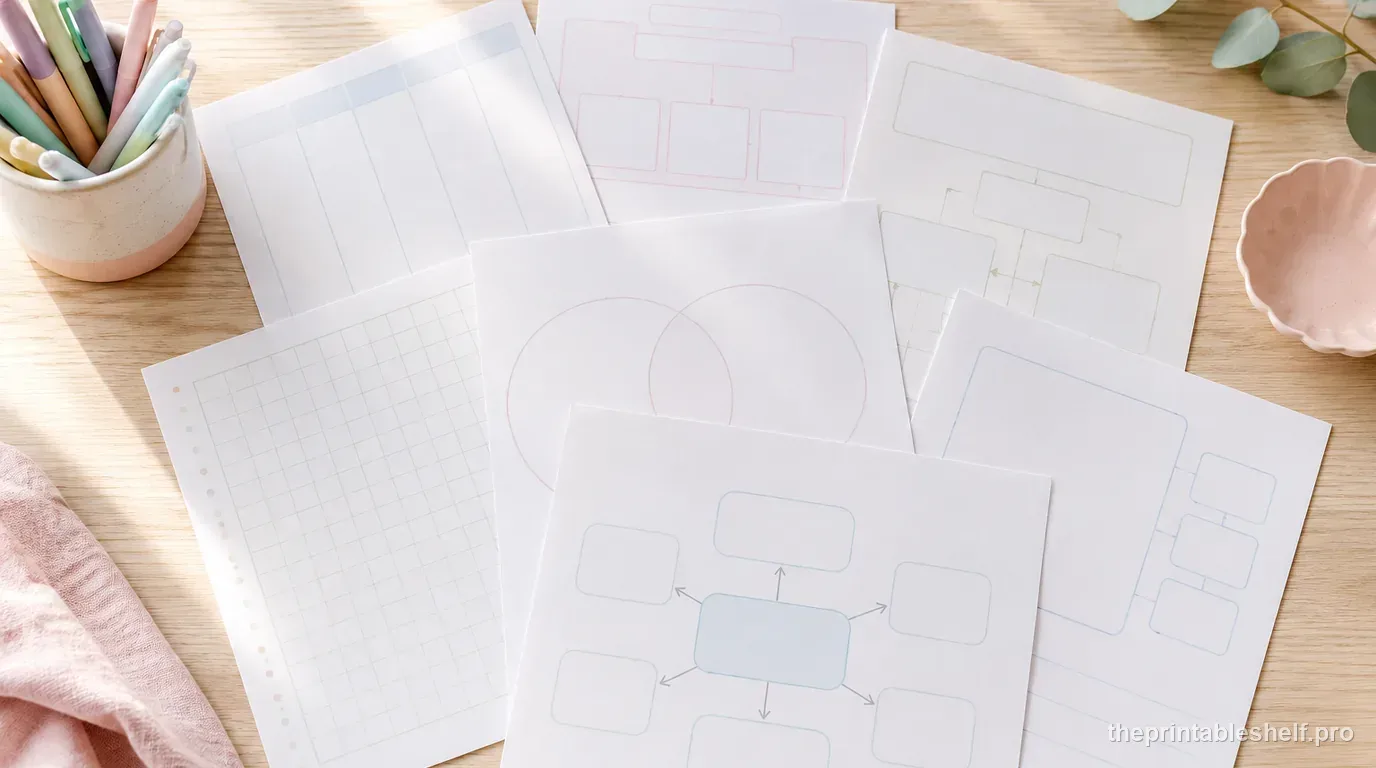
10 Free Graphic Organizers for Reading, Writing, and Studying
Download 10 free graphic organizers for reading, writing, comparison, vocabulary, sequencing, and study. Includes a guide to choosing the right one.
Read guide →
Free Writing Graphic Organizers: Which One to Use and When
Use free writing graphic organizers to plan ideas, structure paragraphs, compare evidence, sequence steps, and organize explanations before drafting.
Read guide →
Free Reading Comprehension Graphic Organizers by Reading Skill
Free reading comprehension graphic organizers for story elements, main idea, sequence, cause and effect, comparison, vocabulary, and prior knowledge.
Read guide →
How to Use Graphic Organizers Effectively (Without Turning Them Into Busywork)
Learn how to choose, model, scaffold, and reuse graphic organizers so students think with them instead of simply filling in boxes.
Read guide →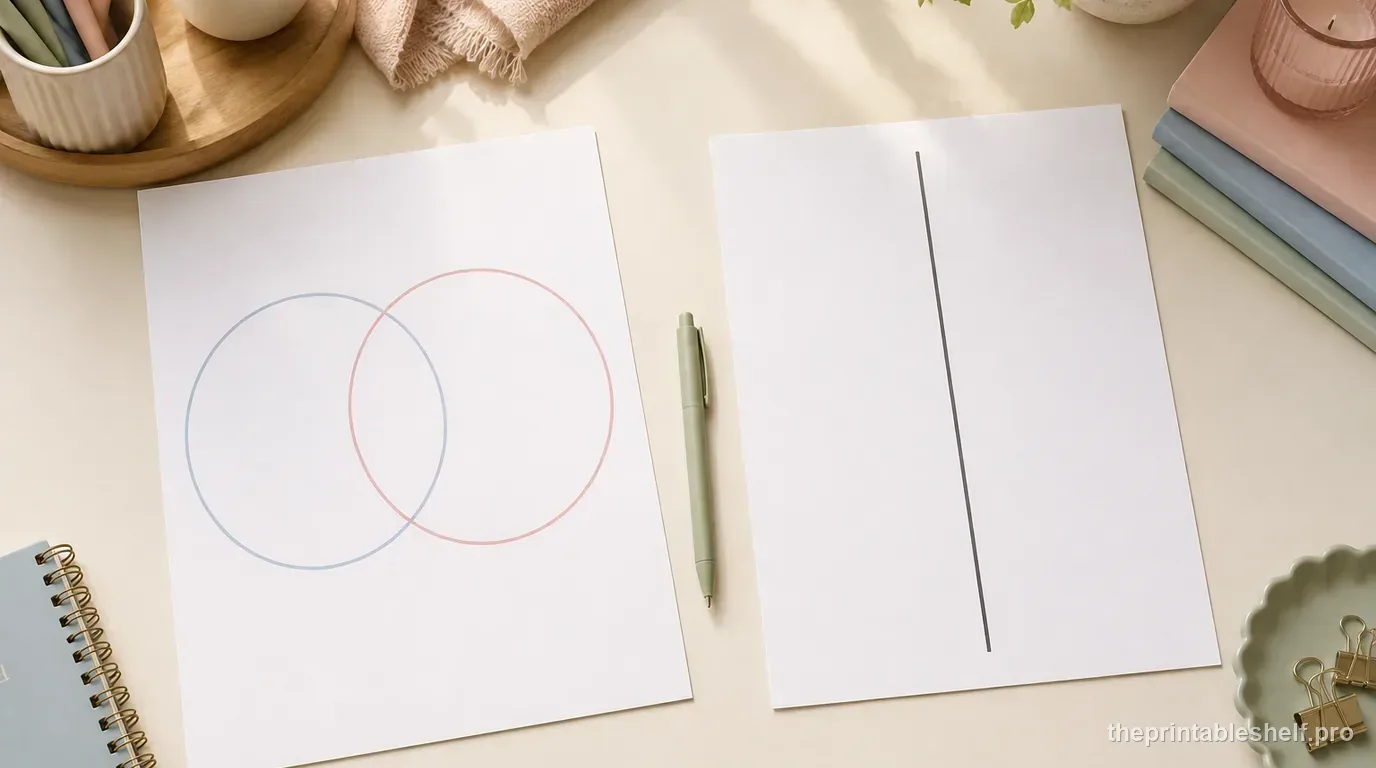
Venn Diagram vs. T-Chart: Which One Should You Use?
Compare Venn diagrams and T-charts, see when each organizer works best, and use a simple decision rule for reading, writing, and classroom tasks.
Read guide →
How to Use a KWL Chart Before, During, and After Reading
Learn how to use a KWL chart before, during, and after reading, with practical prompts, a worked example, and fixes for common KWL mistakes.
Read guide →
How to Compare and Contrast Two Texts Without Just Making a List
Learn how to compare and contrast two texts by matching criteria, gathering evidence, using a Venn diagram, and turning notes into a clear response.
Read guide →
7 Venn Diagram Mistakes That Make Compare-and-Contrast Work Weaker
Fix seven common Venn diagram mistakes, from mismatched criteria to vague overlap, and turn the organizer into stronger compare-and-contrast thinking.
Read guide →Keep organizing
You might also like
Free printable
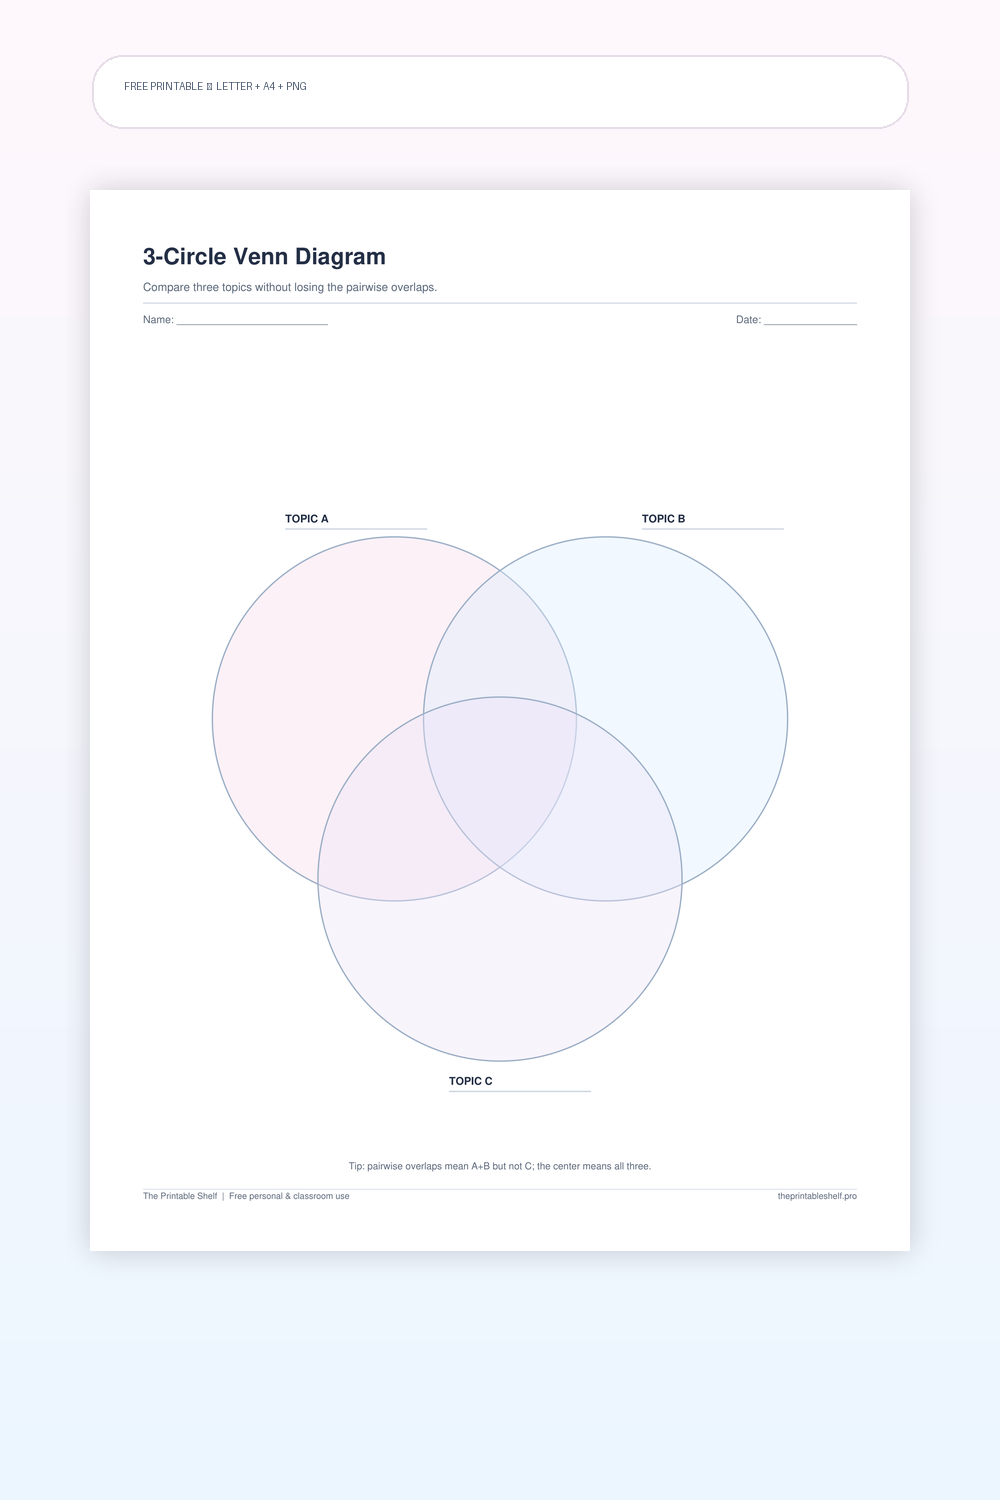
Printable 3-Circle Venn Diagram
A three-set comparison organizer with seven meaningful regions: three outer-only areas, three pairwise overlaps, and one center shared by all three topics. It is more demanding than a standard two-circle Venn, so the layout is intended for concise notes and relationships rather than paragraph-length writing. The page also leaves room to label all three topics clearly before the comparison begins.
Free printable
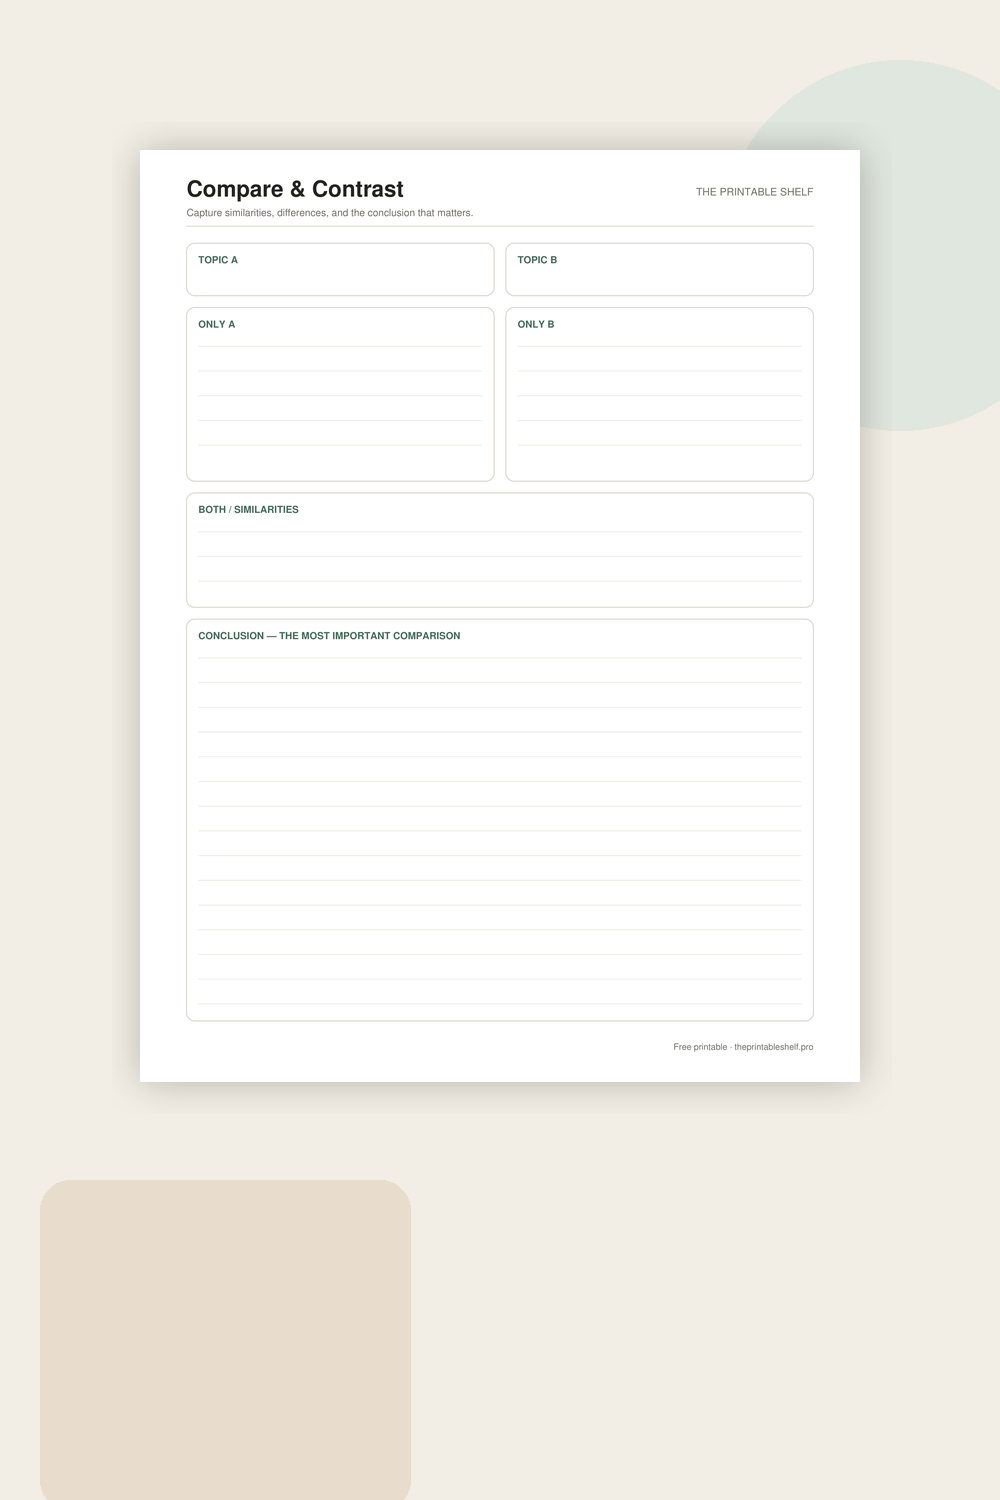
Compare and Contrast Graphic Organizer
A structured alternative to a Venn diagram for learners who need more writing space. Two difference boxes sit side by side, a full-width similarities area keeps shared traits together, and the final conclusion section turns the collected notes into an actual comparison rather than stopping at a list.
Free printable
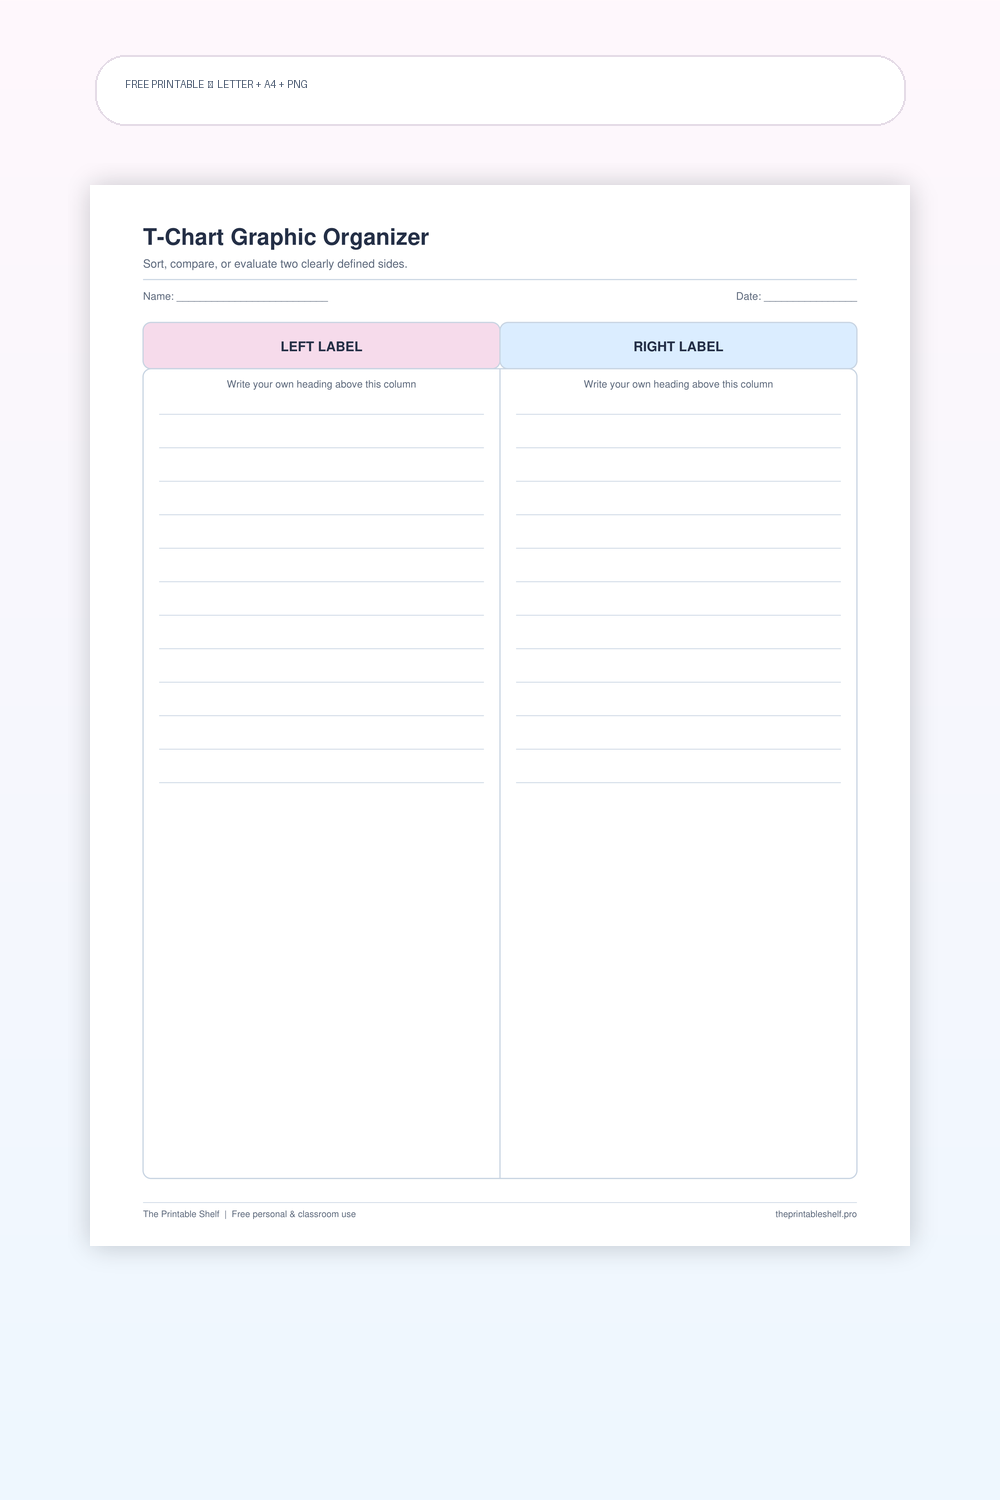
Printable T-Chart Graphic Organizer
A clean two-column thinking sheet that can be relabeled for dozens of school, study, and planning tasks. Unlike a compare-and-contrast organizer with fixed prompts, a T-chart stays intentionally open: the user decides what the two sides mean, which makes it useful for classification, decision-making, text evidence, observation, and quick note sorting.