How-to guide · Work & Study
Venn Diagram vs. T-Chart: Which One Should You Use?
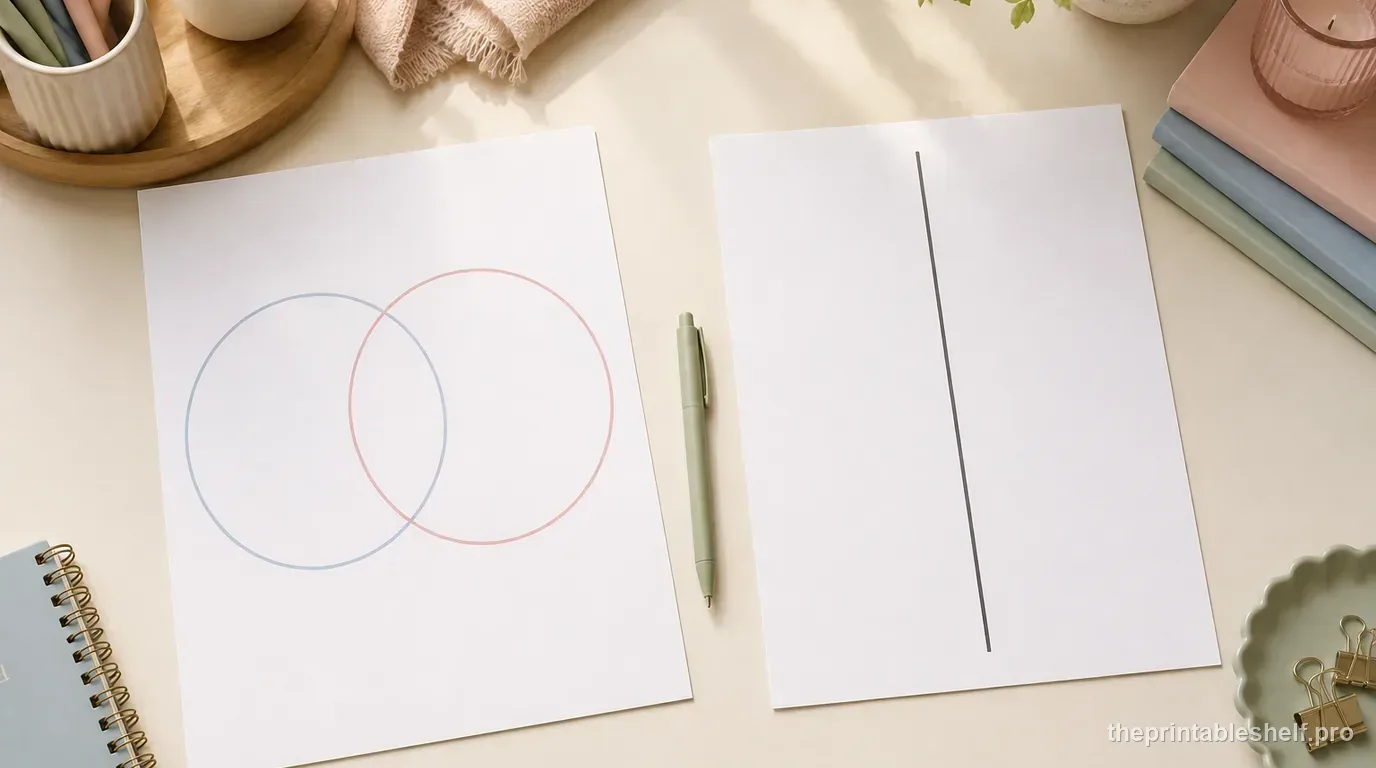
Venn diagrams and T-charts are both simple comparison organizers, but they do not show the same relationship. A Venn diagram makes the shared region physically visible. A T-chart gives each side its own clean column. That difference sounds small until a page becomes crowded or a student starts forcing ideas into the wrong place.
The easiest way to choose is to ask what you want the reader to notice first. If the most important insight is what two subjects share, start with a Venn diagram. If the goal is to keep two sets of information parallel and easy to scan, start with a T-chart.
Quick comparison: Venn diagram vs. T-chart
Both organizers can support compare-and-contrast work, and teaching-resource libraries commonly offer both for that purpose. The practical difference is the geometry: a Venn diagram reserves space for intersection, while a T-chart separates information into two columns. That geometry should match the relationship the learner needs to see.
| Question | Venn diagram | T-chart |
|---|---|---|
| Best visual job | Show unique traits plus true overlap | Keep two categories or sides parallel |
| Best entry length | Short words or phrases | Short phrases to moderate notes |
| Shared information | Has a dedicated overlap region | Must be repeated, summarized, or handled separately |
| Crowding risk | High in the center overlap | Lower because columns use rectangular space |
| Strong examples | Two characters, animals, texts, concepts | Pros/cons, claim/evidence, before/after, two positions |
| Fastest choice when | Similarity is the insight | Sorting into two sides is the insight |
Choose a Venn diagram when overlap is part of the answer
The center of a Venn diagram is not decorative. It asks the learner to identify characteristics that are genuinely true of both subjects. That makes the format especially useful when similarities could otherwise disappear inside two separate descriptions. Two characters may have different backgrounds but share the same motivation. Two habitats may have different climates but support organisms with similar adaptations. Two articles may disagree on conclusions while using some of the same evidence.
Keep entries concise. ReadWriteThink's two-circle Venn guidance uses the outer regions for unique characteristics and the overlap for shared characteristics, which matches the familiar classroom use of the format. If students need to write several sentences of evidence in the overlap, the diagram has probably outgrown the task.
Choose a T-chart when two clean columns matter more than overlap
A T-chart is useful when information naturally sorts into two labeled sides. Examples include fact versus opinion, advantages versus disadvantages, claim versus evidence, before versus after, renewable versus nonrenewable, or two characters compared using the same criterion. Because the writing space is rectangular, longer phrases are easier to scan than they are inside narrow circles.
A T-chart can also work for compare-and-contrast even though it has no intersection. In that case, use parallel criteria. If the left side describes Character A's motivation, the right side should describe Character B's motivation rather than switching to appearance or setting. Parallel categories are what make two columns comparable instead of becoming unrelated lists.
A simple decision rule for students
Ask one question before choosing: 'Do I need a place for BOTH?' If yes, a Venn diagram is usually the clearer first choice. If no, ask whether the information naturally belongs on Side A or Side B. If it does, use a T-chart.
There are exceptions. A student may use a T-chart to compare two books and then write shared traits in a note underneath. Or a Venn diagram may be used for brainstorming even when the final assignment needs longer evidence. The decision rule is a starting point, not a rigid rule.
When a compare-and-contrast organizer is better than either one
Sometimes the task has moved beyond sorting. If the learner needs to explain how a similarity matters, quote evidence, compare the same feature in depth, or write a concluding comparison statement, use a more spacious compare-and-contrast organizer. A Venn diagram is excellent for seeing the pattern; it is not always the best place to develop the argument.
One productive sequence is Venn first, structured comparison second. Brainstorm short observations in the circles, identify the most meaningful pattern, and then transfer only the strongest points into a box-based organizer with room for evidence. That prevents a first-draft brainstorm from becoming the final analysis.
Examples: which organizer fits these six tasks?
Comparing a frog and a toad: use a Venn diagram if the goal is to notice shared and unique traits. Sorting statements into fact and opinion: use a T-chart because every statement should land on one side. Comparing two characters' motivations: either can work, but a Venn diagram is stronger if a shared motivation matters. Listing benefits and drawbacks of school uniforms: use a T-chart. Comparing two news accounts of the same event: start with a Venn diagram for common and unique details, then move to a fuller comparison organizer for evidence. Tracking what changed before and after an experiment: use a T-chart.
Notice that the subject does not determine the answer. The same two texts can be placed in either organizer depending on whether the assignment emphasizes overlap, parallel differences, or extended evidence.
When neither organizer fits the thinking task
Do not force a comparison chart onto a task that is really about order, causation, or hierarchy. If a reader needs to show what happened first and what followed, a sequence organizer will communicate the relationship more clearly. If the question is why an outcome happened, use cause and effect. If the task is to identify one central point and the evidence underneath it, use main idea and details. A familiar worksheet is not automatically the right worksheet.
This is also a useful diagnostic question for students: 'Am I comparing two things, or am I doing something else with the information?' Choosing the structure is part of the thinking. When students can explain why they selected a Venn diagram, T-chart, sequence chain, or another organizer, they are beginning to recognize relationships independently rather than waiting for the page format to tell them what to notice.
Free Sequence of Events Organizer →
Switch to sequence when order is more important than comparison.
Free Cause and Effect Organizer →
Use this when the relationship you need to show is causal rather than simply different.
Free Main Idea and Details Organizer →
Use hierarchy when one central idea is supported by subordinate details.
Common mistakes with Venn diagrams and T-charts
The most common Venn mistake is treating the overlap as a place for vague statements such as 'both are interesting.' Require a trait specific enough to be checked against both subjects. Another problem is squeezing paragraphs into the circles; move longer analysis to a separate response instead.
The most common T-chart mistake is comparing different criteria across the two sides. Keep row logic parallel even if you do not draw horizontal lines. Also avoid labels so broad that almost any statement fits either side. 'Character A / Character B' works only when the task also supplies a comparison focus such as motivation, evidence, response to conflict, or point of view.
Frequently asked questions
Is a T-chart a compare-and-contrast graphic organizer?
Yes. A T-chart can compare two subjects or categories side by side, especially when the entries are organized by parallel criteria. It simply does not have a dedicated overlap region like a Venn diagram.
When is a Venn diagram better than a T-chart?
Choose a Venn diagram when shared characteristics are central to the task and you want students to see the intersection immediately.
Can students use both a Venn diagram and a T-chart for the same topic?
Yes, if they serve different stages. A Venn diagram can surface shared and unique traits, while a T-chart or fuller comparison organizer can organize selected evidence for a later response.
Printables for this topic
Free Printable Venn Diagram Template →
This free Venn diagram template gives you two large overlapping circles for comparing two topics. Put traits unique to each topic in the outer sections and shared traits in the overlap. It works for reading, science, social studies, decision-making, and study review, with Letter, A4, and PNG downloads.
Free Compare and Contrast Graphic Organizer →
This free compare and contrast organizer separates details that belong only to Topic A, only to Topic B, and to both. A conclusion box then asks the learner to state the most important comparison. It works for texts, concepts, people, events, or choices and downloads in Letter, A4, or PNG.
Free Printable T-Chart Graphic Organizer →
A T-chart is a flexible two-column organizer for sorting information into paired categories. Label the left and right sides for the task—such as pros and cons, fact and opinion, claim and evidence, or two topics—then place each note where it belongs. This printable keeps the columns roomy enough for short explanations, not just single words.
Free Printable 3-Circle Venn Diagram →
A 3-circle Venn diagram compares three topics at once, showing traits unique to each topic, traits shared by each pair, and traits shared by all three in the center. This printable is best for short phrases and category-level comparisons where the overlaps themselves matter, such as comparing three texts, organisms, systems, or options.
References
These sources support the instructional background in this guide. The printable recommendations and usage notes above are The Printable Shelf's editorial guidance.
- ReadWriteThink — Venn Diagram, 2 Circles — Classroom guidance for placing shared characteristics in the overlap and unique characteristics in the outer regions of a two-circle Venn diagram.
- ReadWriteThink — T-Chart — Classroom guidance for using a T-chart to examine two facets of an object, situation, event, or comparison across content areas.
- ReadWriteThink — Compare and Contrast Chart — Shows a non-overlapping comparison structure that can move from organized similarities and differences into discussion or writing.
- Reading Rockets — Compare, Contrast, Comprehend — Instructional background on modeling compare-and-contrast thinking, recording similarities and differences in a graphic organizer, and moving from guided to independent practice.
Keep reading
10 Free Graphic Organizers for Reading, Writing, and Studying
Download 10 free graphic organizers for reading, writing, comparison, vocabulary, sequencing, and study. Includes a guide to choosing the right one.
Read guide →
How to Use Graphic Organizers Effectively (Without Turning Them Into Busywork)
Learn how to choose, model, scaffold, and reuse graphic organizers so students think with them instead of simply filling in boxes.
Read guide →
Free Reading Comprehension Graphic Organizers by Reading Skill
Free reading comprehension graphic organizers for story elements, main idea, sequence, cause and effect, comparison, vocabulary, and prior knowledge.
Read guide →
How to Compare and Contrast Two Texts Without Just Making a List
Learn how to compare and contrast two texts by matching criteria, gathering evidence, using a Venn diagram, and turning notes into a clear response.
Read guide →
7 Venn Diagram Mistakes That Make Compare-and-Contrast Work Weaker
Fix seven common Venn diagram mistakes, from mismatched criteria to vague overlap, and turn the organizer into stronger compare-and-contrast thinking.
Read guide →