Printable guide · Work & Study
10 Free Graphic Organizers for Reading, Writing, and Studying
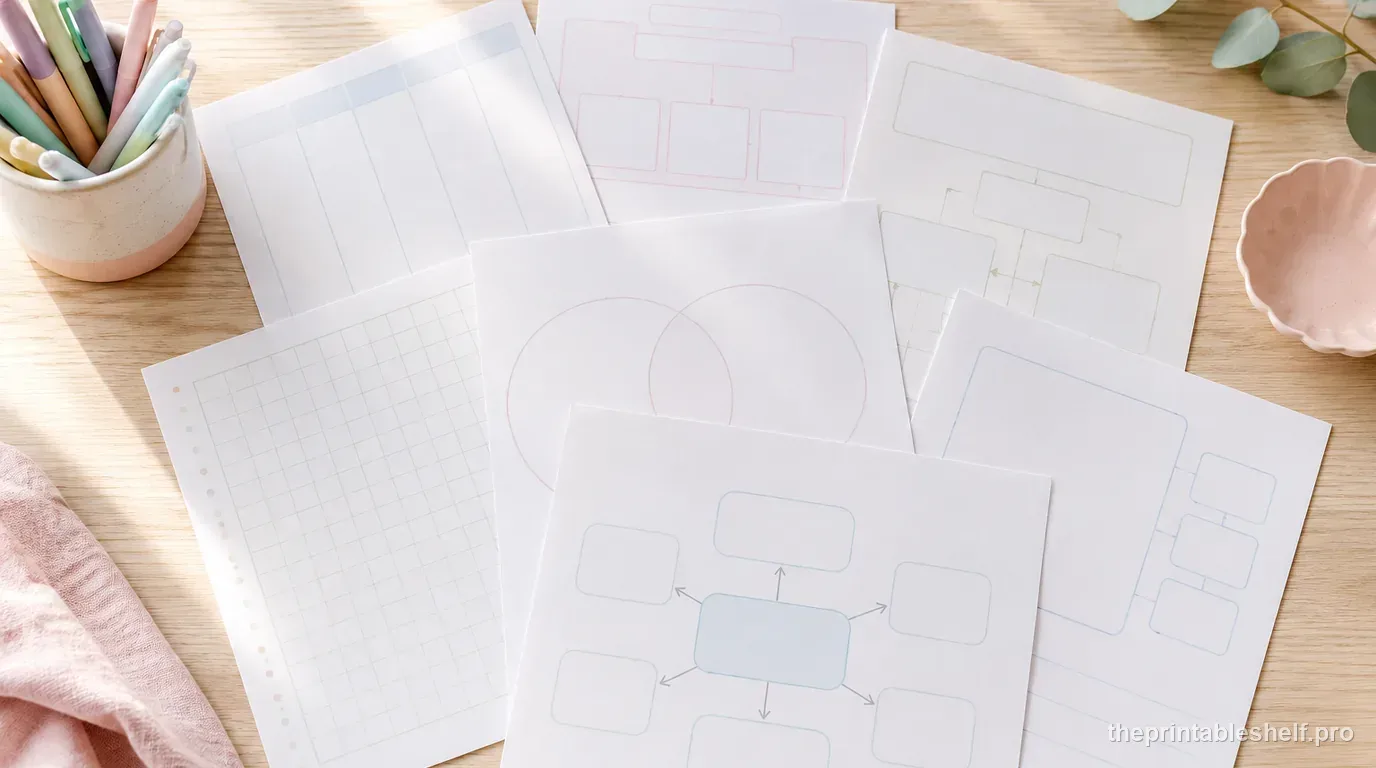
A graphic organizer works best when its shape matches the thinking you are asking a student to do. A Venn diagram is excellent for showing overlap, but awkward for a long explanation. A sequence chart makes order visible, but it is the wrong tool for deciding which supporting detail belongs under a main idea. The fastest way to make these sheets useful is to choose the organizer after you identify the mental job: compare, sequence, explain cause, map a story, sort prior knowledge, define a concept, or plan a piece of writing.
The 10 printables below are intentionally different from one another. They are not the same worksheet with a new heading. Each one gives the learner a visual structure for a particular relationship. All currently available downloads have separate US Letter and A4 PDFs plus a high-resolution PNG, so you can print the format that fits your paper without resizing a screenshot.
Choose the organizer by the thinking task
Before printing anything, finish this sentence: “I need the learner to ___.” If the answer is compare, choose a Venn diagram or compare-and-contrast organizer. If it is explain why, use cause and effect. If it is retell in order, use sequence. If it is identify what matters most, use main idea and details. This one-step check prevents a common classroom problem: completing a graphic organizer becomes the assignment even when the organizer does not help with the actual learning goal.
It also helps to decide how much writing the task requires. Circle-based organizers work best for short phrases and visible relationships. Box-based organizers are better when students need complete thoughts. Note-taking templates such as Cornell notes are designed for repeated use over a lesson or chapter rather than one isolated comprehension question.
10 free graphic organizers and when to use each one
Use this list as a quick matching guide. The descriptions focus on what each page helps a learner do, not just what the layout looks like.
Cornell Notes Template →
Best for turning lesson or reading notes into a review tool. The notes column captures information, the cue column becomes self-test questions, and the summary prompts a short synthesis of the page after the lesson.
KWL Chart →
Use before and after a lesson to separate what a learner already knows, what they want to find out, and what they can now explain. It works especially well at the start of a new unit or research topic.
Story Map →
Best for narrative comprehension when the goal is to connect character, setting, problem, important events, and resolution instead of producing a simple chronological list.
Main Idea and Details Organizer →
Use when students need to distinguish the central point from evidence or supporting information. It is a strong choice for nonfiction paragraphs, textbook sections, and short informational passages.
Compare and Contrast Organizer →
Choose this when students need more writing room than a Venn diagram provides. Separate boxes make it easier to explain meaningful differences, shared traits, and a final comparison conclusion.
Venn Diagram →
Best for a quick visual comparison of two topics. Put unique traits in the outer regions and only genuinely shared traits in the overlap.
Cause and Effect Organizer →
Use to show why something happened and what resulted. It works for reading, history, science, and any situation where students must justify a causal relationship instead of listing events.
Sequence of Events Organizer →
Use when order itself matters: plot events, procedures, historical developments, life cycles, or the steps in a process. It keeps chronology separate from cause-and-effect reasoning.
Frayer Model Vocabulary Template →
Best for learning a concept in depth. Definition, characteristics, examples, and non-examples push students beyond copying a dictionary sentence.
Four-Square Writing Organizer →
Use for prewriting when a student has a topic but needs to turn it into a central idea plus organized supporting points before drafting.
Venn diagram or compare-and-contrast organizer?
These two are easy to confuse because both compare two subjects. Choose the Venn diagram when the important idea is the relationship between three regions: only A, both, and only B. Its strength is instant visual pattern recognition. Choose the box-based compare-and-contrast organizer when students need to explain why a similarity or difference matters, write longer evidence, or end with a comparison statement.
A useful progression is to brainstorm with the Venn diagram first and then move the strongest observations into the compare-and-contrast sheet. That turns a quick visual sort into material for a paragraph or discussion without asking the first organizer to do two jobs at once.
Story map, sequence chart, or cause-and-effect chart?
For a story, decide what you want the student to notice. A story map is about narrative structure: who, where, the central problem, the events that matter, and how the problem changes or resolves. A sequence chart is narrower. It asks what happened first, next, and later. A cause-and-effect chart asks why an event happened or what changed because of it.
The same chapter can legitimately use all three organizers, but they should not be assigned as three versions of the same task. A reader might first sequence the key events to get the plot straight, then use a cause-and-effect page to analyze one turning point, and finally complete a story map to summarize the whole narrative. Each page should have a distinct purpose and reduce cognitive clutter rather than add another worksheet for the sake of activity.
How to introduce a new graphic organizer
Do not hand out a blank organizer and assume the labels teach the strategy. Model an example with familiar content first. Name the thinking move, fill representative sections aloud, and explain why a piece of information belongs there. Reading Rockets recommends explicit modeling and gradual movement from completed or partly completed organizers toward independent use, particularly when students are learning to recognize text structure.
Once the format is familiar, reduce the scaffolding. Let students decide what belongs in each section, compare answers with a partner, or choose between two possible organizers and justify the choice. At that point the sheet is supporting independent thinking instead of functioning as a coloring-in exercise.
Blank, guided, or partly completed: choose the right amount of support
A blank organizer is not automatically more rigorous. When students are meeting a text structure for the first time, a partly completed example can free attention for the relationship you want them to notice. You might supply the main idea and ask students to select supporting details, place the first event in a sequence, or model one cause-and-effect pair before they complete the rest. Once the structure is familiar, move toward a blank version so the learner makes more of the decisions.
The same principle applies to younger students, multilingual learners, and anyone working with a text that is unusually dense. Reduce the writing demand without removing the thinking demand. A shorter phrase, a drawing plus a label, or one prefilled example can make the organizer accessible while preserving the core task. Support should make the relationship clearer, then fade as the learner becomes more independent.
A simple way to avoid worksheet overload
Keep the organizer only if you will use what is written on it. A story map can become the outline for an oral retell. A main-idea page can become a summary paragraph. Cornell cues can become review questions. A Venn diagram can feed a comparison response. When the completed page has a next step, students have a reason to make distinctions carefully.
For repeated routines, use the same format long enough that students stop spending attention on where to write. For new or complex tasks, choose the organizer deliberately and explain the purpose. Consistency and task-fit matter more than collecting dozens of decorative templates.
Frequently asked questions
What is the easiest graphic organizer to start with?
For comparison, a two-circle Venn diagram is easy to understand. For reading, a simple story map or main-idea-and-details organizer is often a better starting point because the labels directly match common comprehension tasks.
Can the same graphic organizer be used in different subjects?
Yes. Cause-and-effect, sequence, comparison, concept, and note-taking structures work across reading, science, social studies, and study tasks. The thinking relationship matters more than the subject label.
Should students use a graphic organizer for every assignment?
No. Use one when it makes relationships, hierarchy, order, or planning clearer. If the student already understands the structure and the organizer adds an unnecessary step, it can be skipped.
Printables for this topic
Free Printable Cornell Notes Template →
This free Cornell notes template divides one page into a cue column, a larger notes area, and a summary section. Take notes on the right, add questions or key terms on the left afterward, then summarize the page in your own words after class. Download it in Letter, A4, or PNG format.
Free Printable KWL Chart →
A KWL chart helps learners organize what they already know, what they want to find out, and what they learned. Fill in K and W before reading or instruction, then return to L afterward. This free version includes writing lines and comes in US Letter, A4, and PNG formats.
Free Printable Story Map Template →
This free story map printable gives students space for characters, setting, the central problem, and a beginning-middle-end story arc. Use it to plan original writing or map a story after reading. Separate Letter, A4, and PNG downloads make it easy to use at home, in class, or in a binder.
Free Main Idea and Details Graphic Organizer PDF →
Use this main idea and details organizer to separate what a text is mostly saying from the facts, examples, or reasons that support it. The printable includes a topic box, one main-idea statement, three supporting-detail boxes, and a summary section. Download it in Letter, A4, or PNG format.
Free Compare and Contrast Graphic Organizer →
This free compare and contrast organizer separates details that belong only to Topic A, only to Topic B, and to both. A conclusion box then asks the learner to state the most important comparison. It works for texts, concepts, people, events, or choices and downloads in Letter, A4, or PNG.
Free Printable Venn Diagram Template →
This free Venn diagram template gives you two large overlapping circles for comparing two topics. Put traits unique to each topic in the outer sections and shared traits in the overlap. It works for reading, science, social studies, decision-making, and study review, with Letter, A4, and PNG downloads.
References
These sources support the instructional background in this guide. The printable recommendations and usage notes above are The Printable Shelf's editorial guidance.
- Reading Rockets — Comprehension: In Practice — Background on using graphic and semantic organizers to focus on text structure and relationships.
- REL / Institute of Education Sciences — Toolkit for Teaching K–3 Reading Comprehension — Examples of explicit modeling and graphic-organizer use within comprehension instruction.
Keep reading
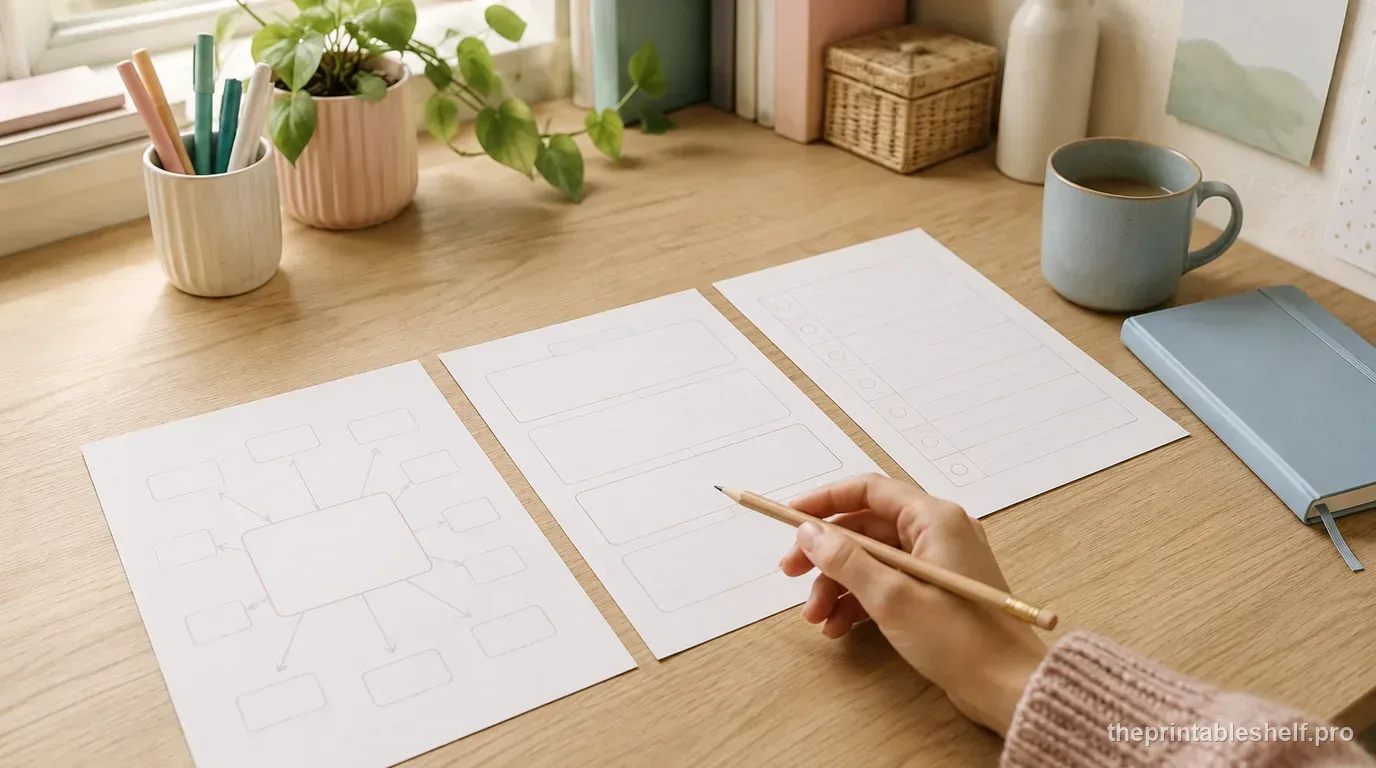
Free Writing Graphic Organizers: Which One to Use and When
Use free writing graphic organizers to plan ideas, structure paragraphs, compare evidence, sequence steps, and organize explanations before drafting.
Read guide →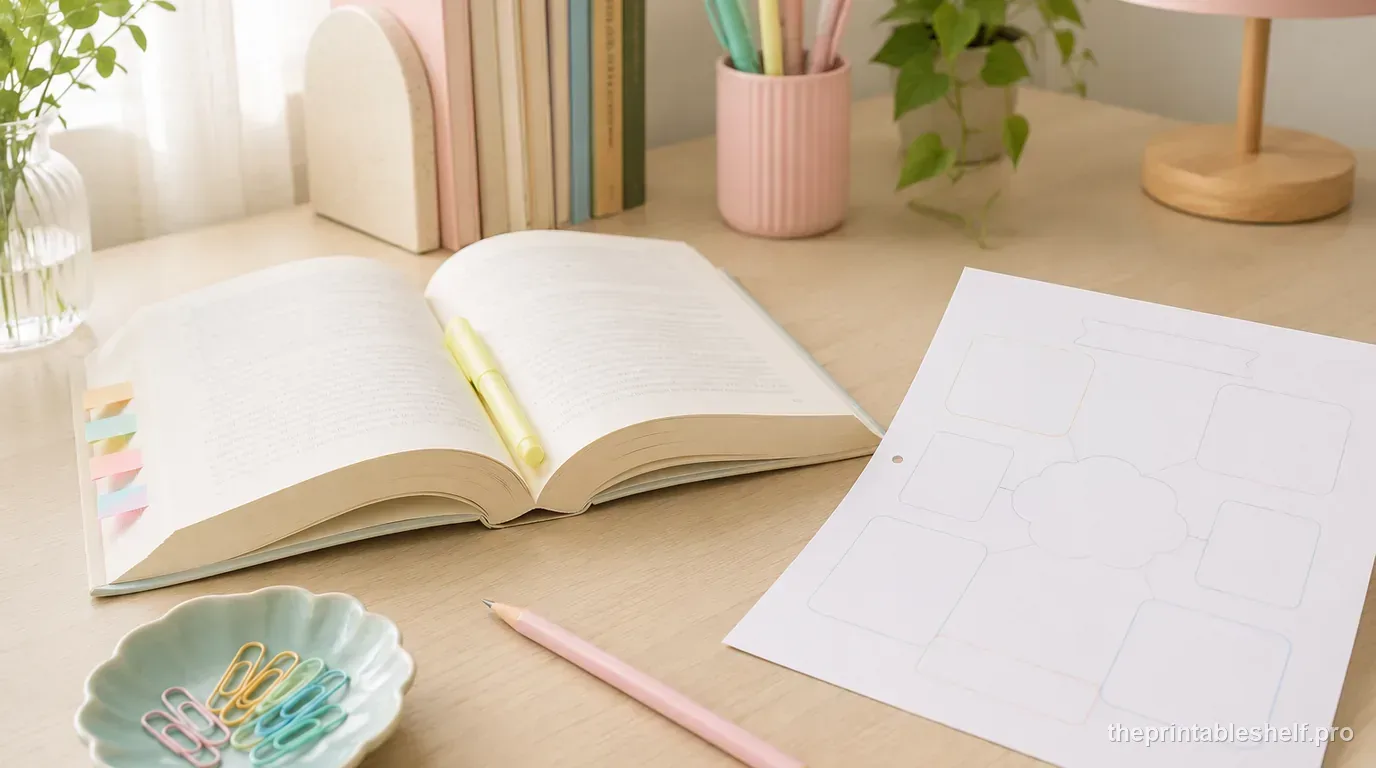
Free Reading Comprehension Graphic Organizers by Reading Skill
Free reading comprehension graphic organizers for story elements, main idea, sequence, cause and effect, comparison, vocabulary, and prior knowledge.
Read guide →
How to Use Graphic Organizers Effectively (Without Turning Them Into Busywork)
Learn how to choose, model, scaffold, and reuse graphic organizers so students think with them instead of simply filling in boxes.
Read guide →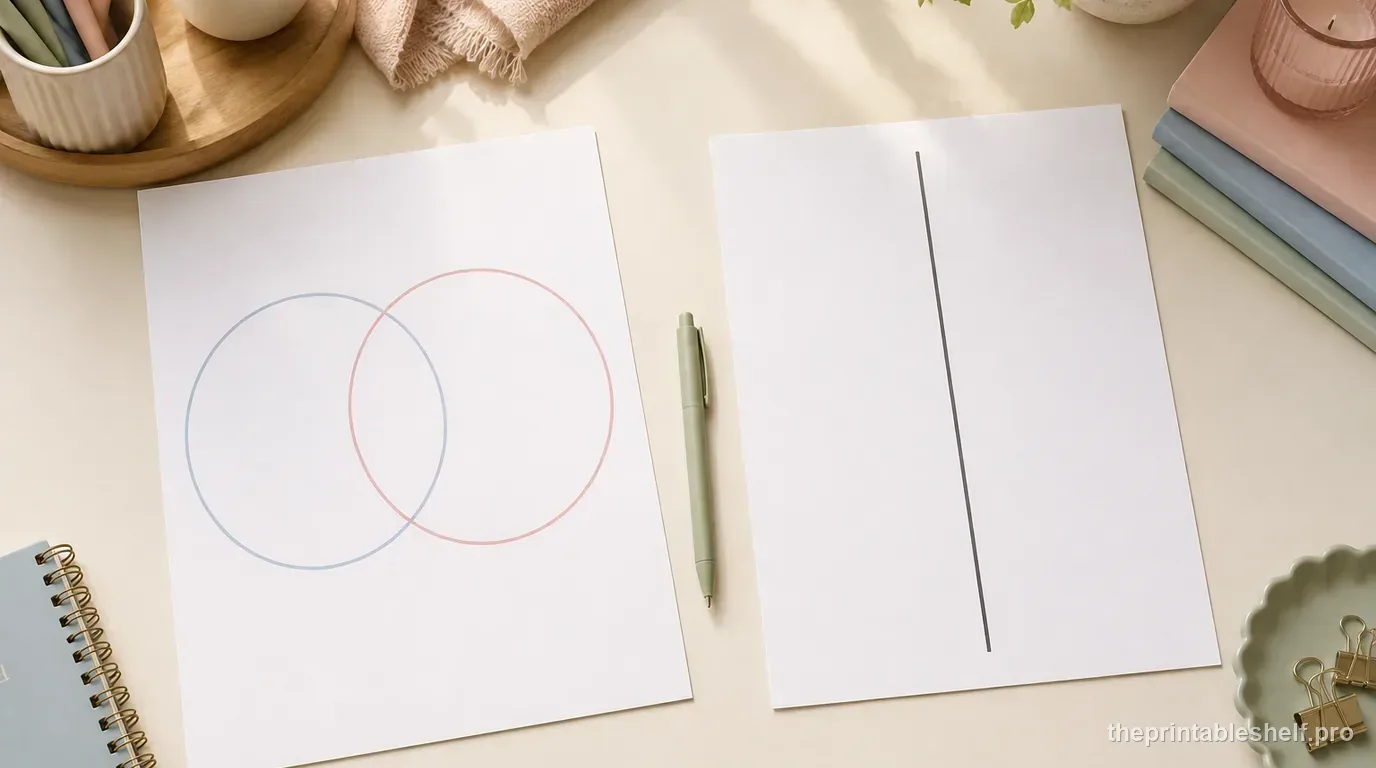
Venn Diagram vs. T-Chart: Which One Should You Use?
Compare Venn diagrams and T-charts, see when each organizer works best, and use a simple decision rule for reading, writing, and classroom tasks.
Read guide →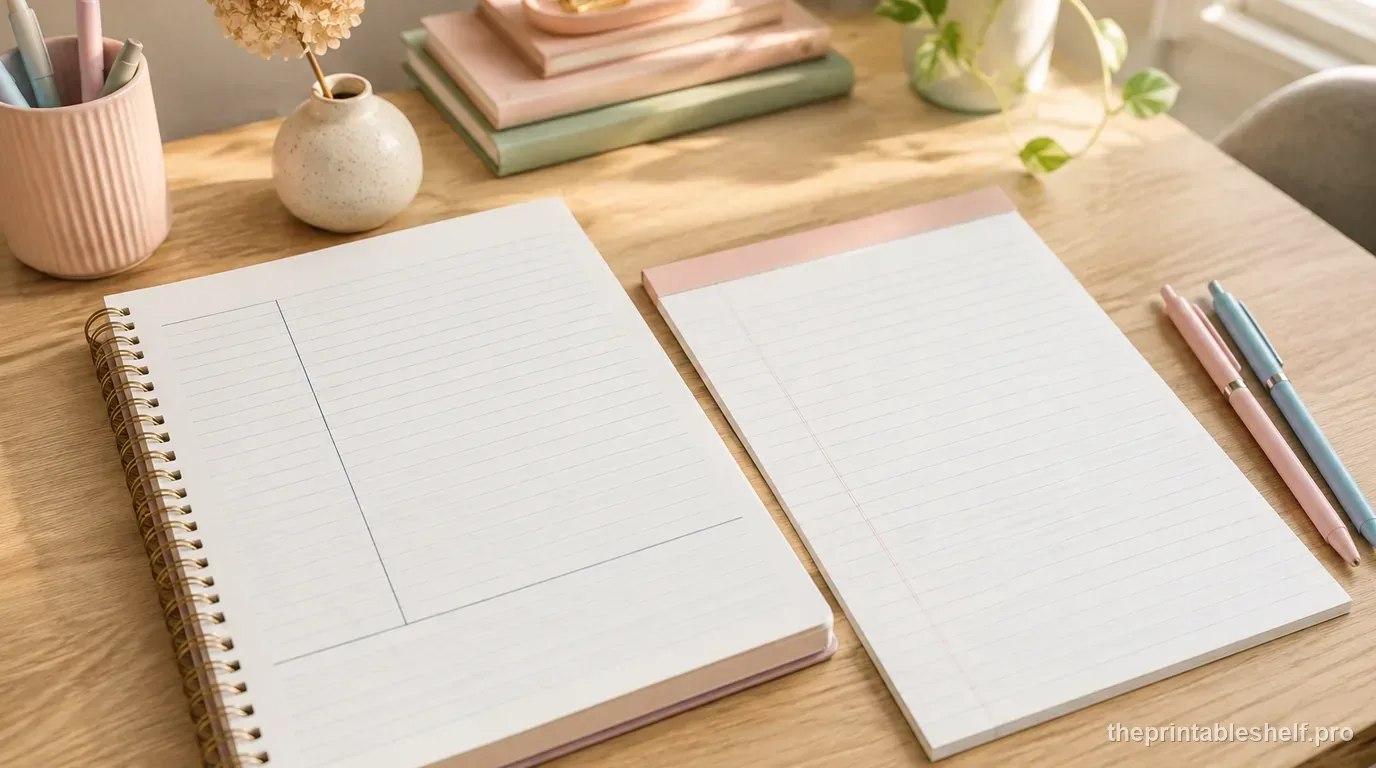
Cornell Notes vs. Outline Method: Which Is Better for Studying?
Compare Cornell notes with the outline method for lectures, textbooks, studying, review, and self-testing, then choose the format that fits the task.
Read guide →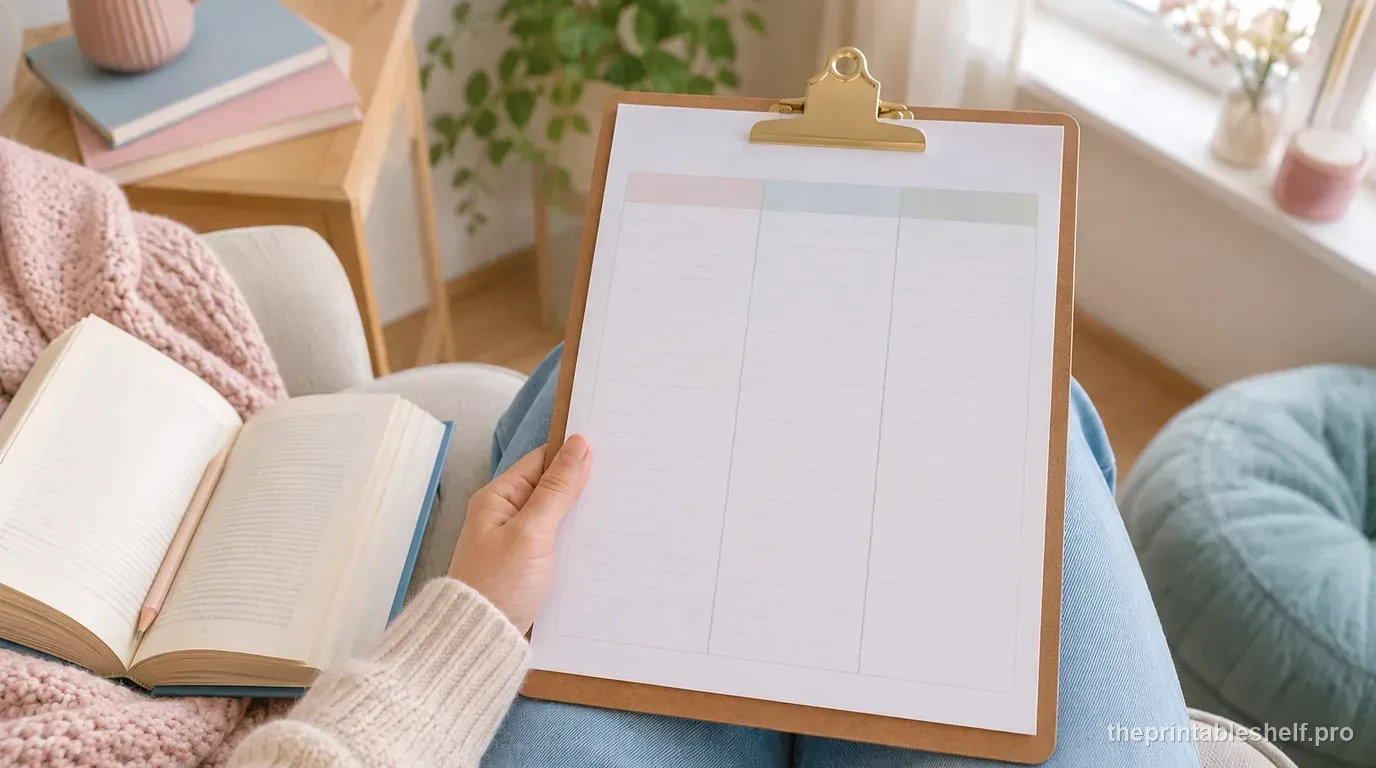
How to Use a KWL Chart Before, During, and After Reading
Learn how to use a KWL chart before, during, and after reading, with practical prompts, a worked example, and fixes for common KWL mistakes.
Read guide →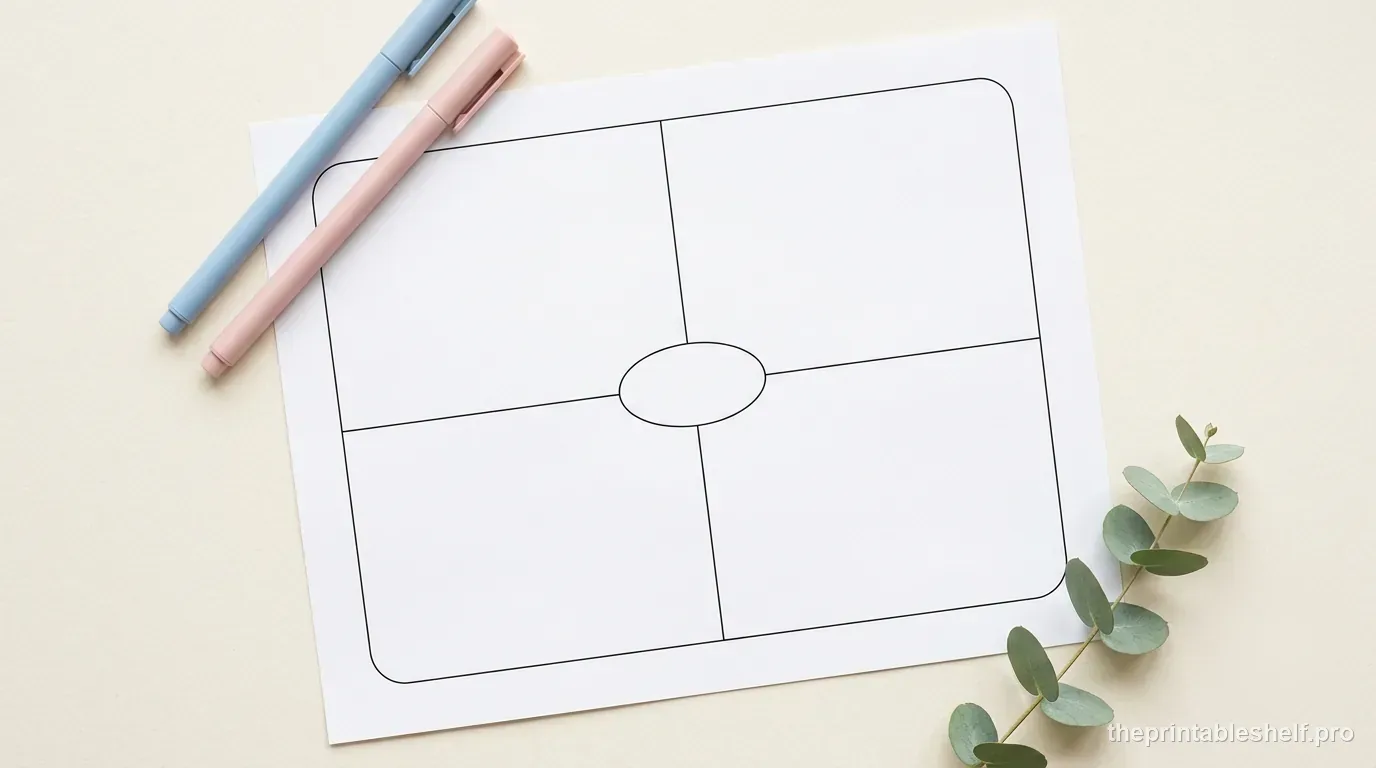
Frayer Model Examples and Non-Examples: How to Choose Ones That Actually Teach the Concept
Learn how to choose strong Frayer Model examples and non-examples, including near-misses, defining characteristics, and worked examples across subjects.
Read guide →